Global Climate Change: Current Status & The Future Risks
India would warm by 3oC or higher by the end of this century: How the World's largest democracy would cope with it?Dr. Murari Lal Technical Head (Climate Change)RMSI Pvt Ltd., A-7 Sector 16, Noida-201...

Dr. Murari Lal
Renowned Climatologist & Nobel IPCC Team Member
India would warm by 3oC or higher by the end of this century: How the World's largest democracy would cope with it?
Dr. Murari Lal Technical Head (Climate Change)
RMSI Pvt Ltd., A-7 Sector 16, Noida-201301, INDIA
E-mail:lal321@hotmail.com, Mobile: +91 9811904828
28 August 2025
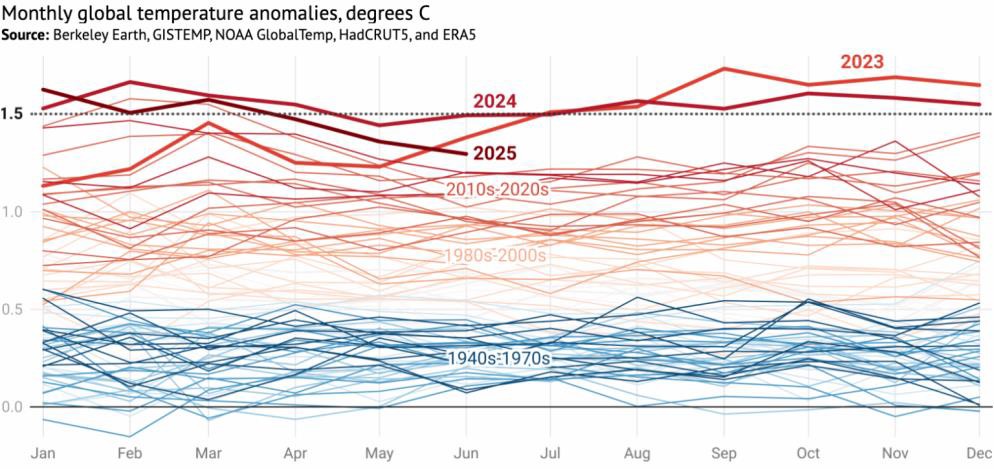
Global warming continues unabated, exactly as predicted correctly since the 1980s and millions of people are increasingly suffering the consequences. The global-average temperature for the northern hemisphere summer of June–August 2024 was the highest on record. The Copernicus Climate Change Service has reported the warmest January 2025, with global mean surface – air temperatures 1.75°C above preindustrial levels continuing the record temperatures observed throughout the last two years (June 2025 has recorded the third-highest June global surface temperature since 1850; Figure 1a). The average global mean surface air temperature for the year 2024 was 1.55°C above pre-industrial temperatures (Figure 1b). During 2024, 24% of the Earth’s surface had a locally record warm annual average, including 32% of land areas and 21% of ocean areas (increasing heat is making more of the planet uninhabitable). The land areas recorded a staggering 2.3°C above pre-industrial levels on an average which coincidentally aligned with a number of major population centres (Figure 2). About 3.3 billion people — 40% of Earth’s population — experienced a locally record warm annual average in 2024 (partly boosted by a strong El Niño event). The last 10 years have included all 10 of the warmest years observed in the instrumental record.
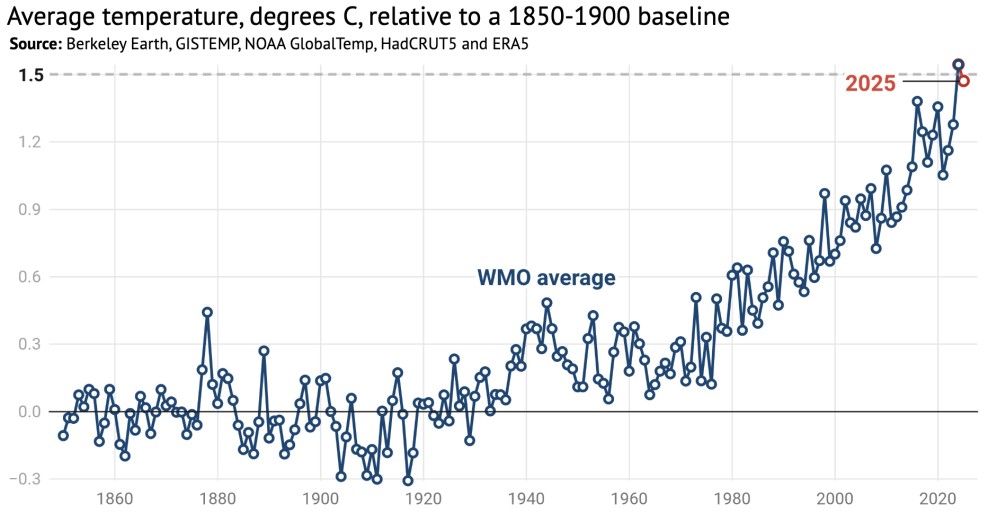
Figure 1a: Global monthly mean surface air temperature anomalies.
Figure 1b: Global mean annual surface air temperature anomalies, Jan 1850 to Apr 2025.
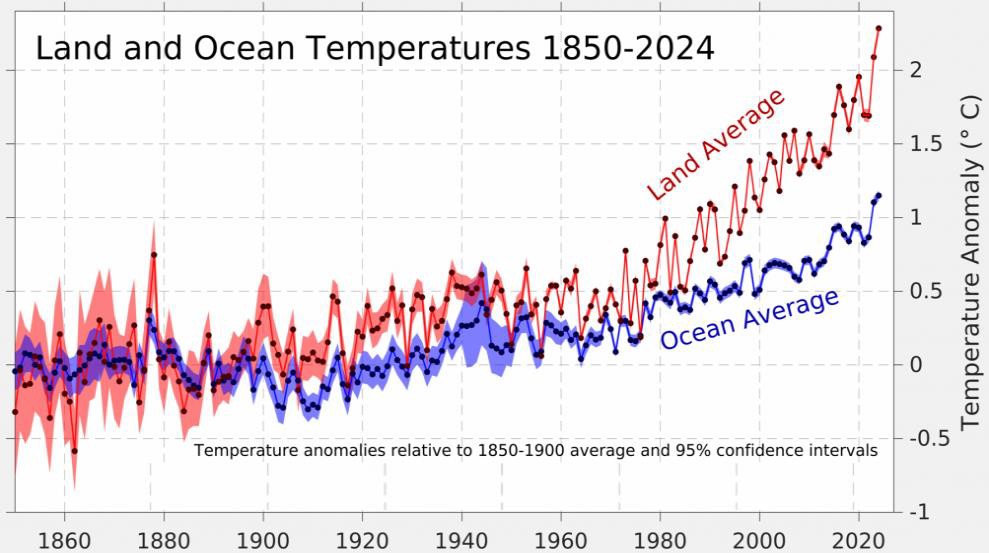
Figure 2: Global mean land and ocean temperature anomalies with respect to 1850-1900 average.
Global warming is primarily attributable to humans via greenhouse gas emissions (primarily Carbon Dioxide, Methane
and Nitrous Oxide), which reached an all-time high in 2024, combined with a variety of other natural factors that contribute to natural short-term variability in the climate system (Figure 3). The atmospheric concentrations of carbon dioxide and methane have reached record levels in 2024, at 422.1 ppm and 1897 ppb respectively. Through addressing these three greenhouse gases we stand a chance of staving off the most devastating effects of climate change. Methane, which is short-lived, is increasingly in the world’s crosshairs because it is responsible for at least a third of current warming. It is also 80 times more potent than carbon dioxide in the first 20 years after its emission. Rising levels of atmospheric methane are directly at odds with the reductions needed to meet the Paris Agreement goals. Nitrous Oxide remains in the atmosphere for around 120 years, about a tenth as long as carbon dioxide and traps 270 times more heat per tonne than Carbon Dioxide. Measures to address nitrous oxide emissions would also tackle other air pollutants thus improving air quality. Further, various carbon sinks, such as in the Arctic and the Amazon have weakened and have both become net emitters of greenhouse gases, and the failure of the land sink since 2023. World’s fossil-fuel producers are on track to nearly quadruple the amount of extracted oil and gas from newly approved projects by the end of this decade, with the United State leading the way in a surge of activity. The failure to reduce emissions fast and the intention of petrostates and big oil companies to continue expanding production puts Earth on a path to 3°C of warming or more, given the political inertia and the inertia of the energy system.
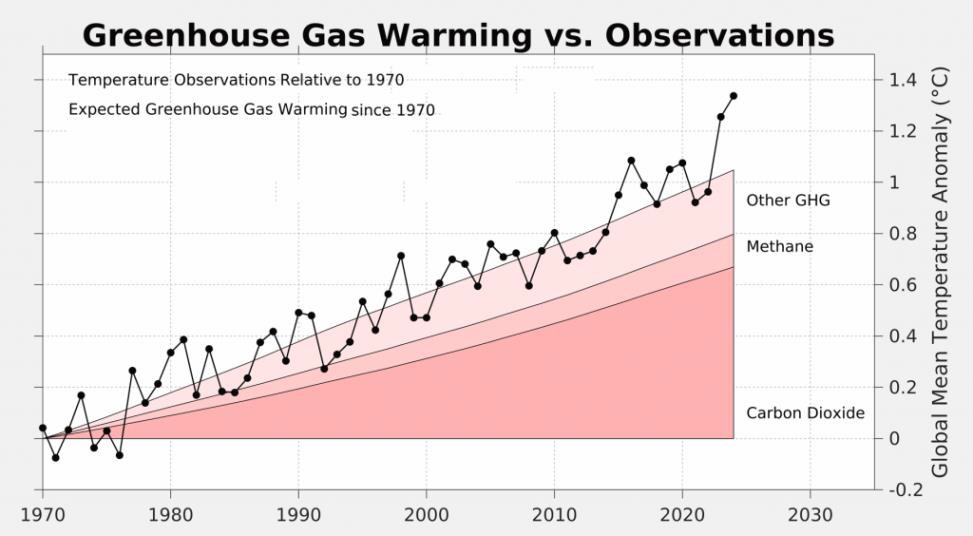
Figure 3: Observed warming could be attributed to GHG Emissions and other natural factors.
Interestingly, 2024 was the wettest year for extreme precipitation as measured by maximum 1-day rainfall amounts. Record-breaking extremes mostly occurred within the tropical belt. The total amount of water in the atmosphere reached a record value in 2024, at 4.9% above the 1991–2020 average, markedly higher than in 2016 (3.4%) and 2023 (3.3%), the years with the second and third highest values (Figure 4). The record high water vapour value for 2024 was
influenced by a combination of increased surface evaporation from the ocean due to higher sea surface temperatures and by the ability of a warmer atmosphere to hold more moisture. Water vapour plays a crucial role in the climate system, as it significantly contributes to Earth’s natural greenhouse effect. Unlike other greenhouse gases, such as carbon dioxide and methane, the concentration of water vapour is not directly influenced by human activities. However, as the atmosphere warms, it can hold more water vapour (about 7% more for each additional degree Celsius). In turn, the greater water vapour content further amplifies warming, a process known as ‘temperature-water vapour feedback’. Increased moisture in the atmosphere also heightens the potential for extreme rainfall events and provides energy for more intense tropical storms.
Figure 4: Annual global mean total column water vapour anomalies for 60N to 60S inferred from ERA5 data (Reference period: 1991-2020).
The physical risks may be abrupt and difficult to predict, and they may also cascade in a domino fashion that is difficult to incorporate into climate models which also do not adequately account for the full range of reinforcing feedbacks. The past few years have seen an unprecedented number of climate-related disasters including extreme weather events across the world. Every fraction of a degree of warming above 1.5oC is expected to increase the intensity and frequency of extreme weather events across the globe. The severity and frequency of extreme events such as heatwaves, heavy spells of rainfall, floods, droughts and storms, as well as record-breaking global temperatures, have already become unprecedented. For example, February 2025 was India’s hottest in 125 years, with many states breaching 40°C as reports of heat-related deaths came in from Telangana, Gujarat, Punjab, and Odisha. During the year 2025, the monsoon rains during July - August have caused flooding and landslides that have swept away entire villages, killing thousands and leaving many residents trapped in the rubble and scores missing in Northen India where cloud bursts, flash floods, landslides and inundated cities have exposed the region’s growing vulnerability to climate- related disasters. In China’s Inner Mongolia province, 13 people have been killed in floods caused by climate change induced heavy rainfall and severe floods this year that are posing major challenges, including economic losses running into billions. Ongoing emissions and the loss of natural carbon sinks will drive further warming and more severe disruptive events globally (Figure 5). There is a time lag between emissions and the warming that is experienced, meaning that unless emissions are reduced, more warming is in the pipeline. If unchecked they could become catastrophic, including loss of capacity to grow major staple crops under altered climate patterns, multi-metre sea level rise, and a further acceleration of global warming.
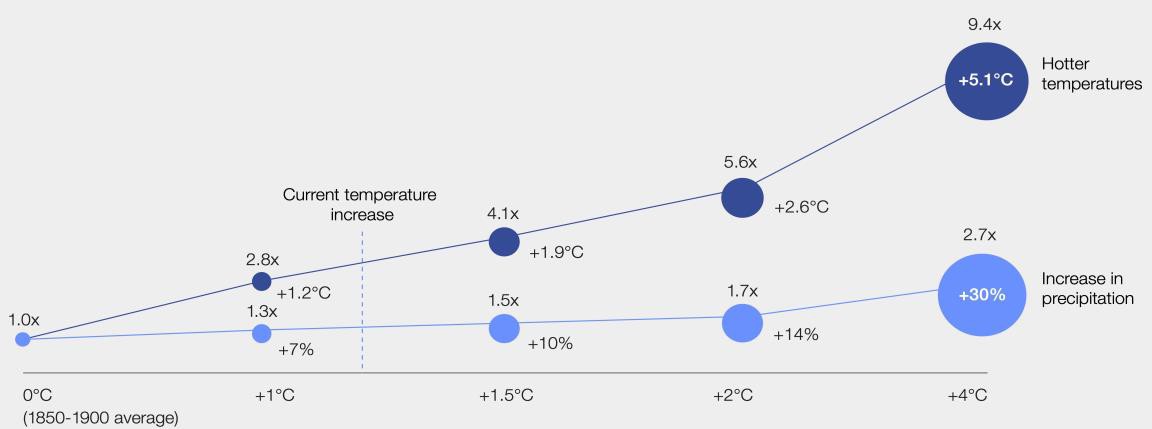
Figure 5: Projected increase in frequency and intensity of heat waves and heavy rainfall under different warming scenarios.
The Earth’s energy imbalance — the difference between incoming energy from the sun and the amount of heat radiating from Earth back into space — has more than doubled since 2000 (Figure 6), massively exceeding the increase predicted by climate models. In 2023, the imbalance reached 1.8 watts per square meter (0.16 watts per square feet), which was twice what models estimated based on rising greenhouse gas emissions. Regardless of why Earth's Energy Imbalance (EEI) is growing so rapidly, the implications are alarming. The larger the imbalance is, the faster climate change happens - If we have more imbalance, that means more energy accumulating, and temperatures rise faster. Earth is absorbing energy at an accelerating rate as depicted in Figure 6 meaning thereby that the global warming has accelerated (is further strengthened from trend in global warming filtered for natural forcings as seen in Figure 7 below) although this does not seem to be fully accounted for in our current climate models. Perhaps the removal of sulphur from ship emissions (which was cooling the planet as a form of unintentional solar radiation management) is one of the leading factors to a greater and faster warming than is accounted for in the models.
The ocean, being the largest heat reservoir on Earth, plays a crucial role in absorbing and storing the excess energy from the Sun. Numerous studies have shown that most of the heat in the Earth’s energy budget due to the greenhouse effect is absorbed by the oceans. Therefore, EEI should directly correspond with changes in ocean heat content (OHC). Ocean temperature data give some indication of Earth's energy imbalance (Figure 8), but these records only reveal trends a decade after they have happened, and give a much less spatially-refined picture of the imbalance. This accelerated rate of warming is likely to continue to mid-century given the failure so far to reduce planet-warming greenhouse gas emissions.
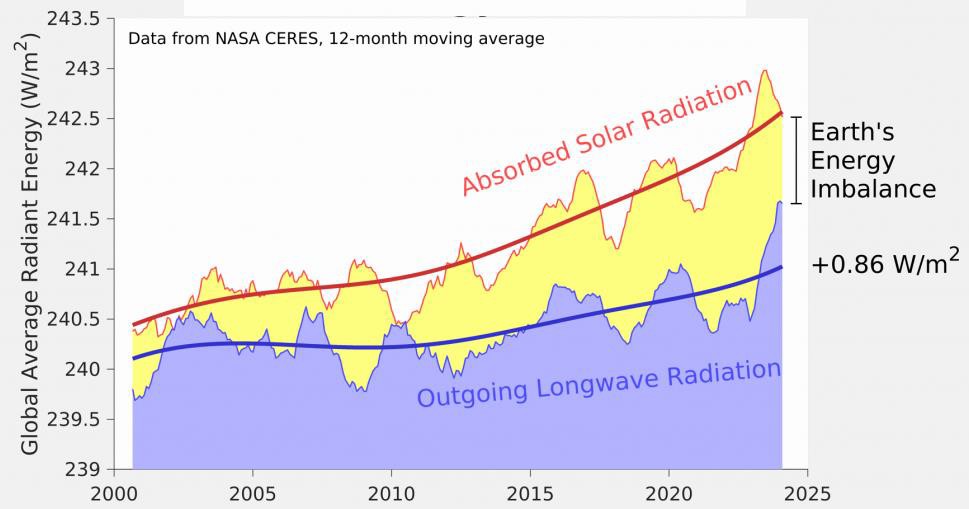
Figure 6: Earth's energy imbalance has more than doubled in recent years.
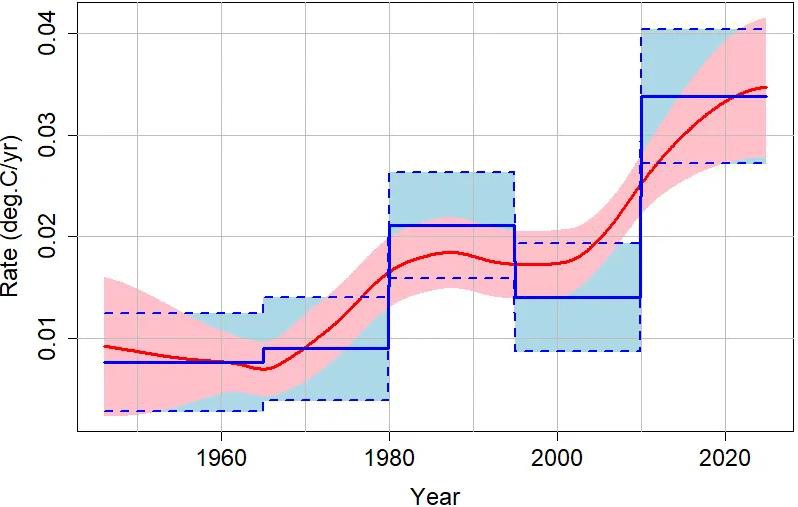
Figure 7: Removing the natural variability (e.g., effects of short-term variability – El Niño and La Niña events, volcanic eruptions, and changes in the solar cycle) in global temperature trend strengthens evidence of acceleration (Source: Berkley Earth).
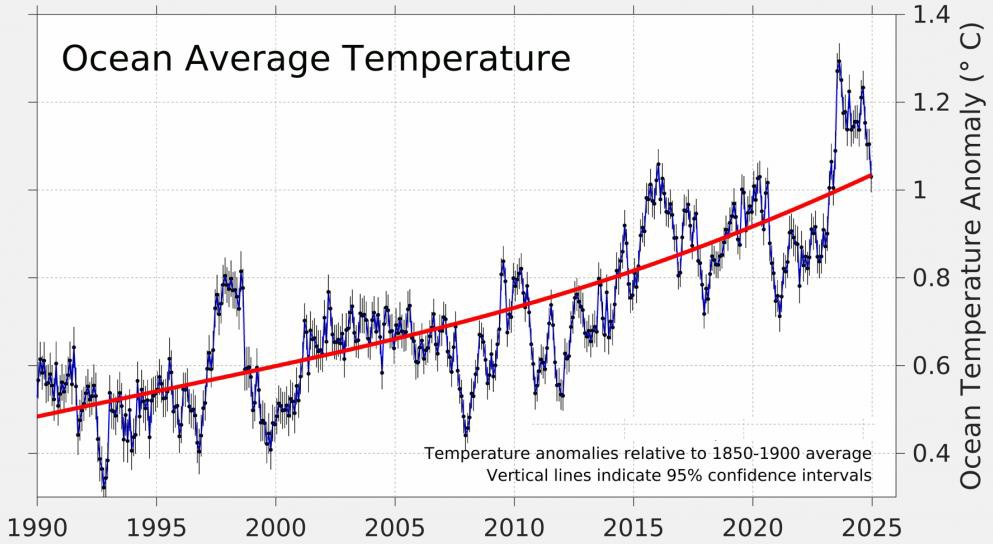
Figure 8: Monthly time series of ocean average temperatures shifted sharply higher in the middle of 2023, peaked late in 2023 but persisted well-above the long-term trend until late in 2024 — including the largest January to June ocean warming ever observed in 2024.
The abrupt new records of surface warming set in 2023 and 2024 (possibly could be linked to a decline in low-altitude clouds which are reducing Earth’s reflectivity, allowing more heat to be absorbed) join other evidence that recent global warming has accelerated because of human-induced climate warming (Figure 9), loss of reflective cloud cover and an unusually warm phase of oceanic variability, with unprecedented Sea Surface Temperature anomalies (average SSTs were 1.1°C above pre-industrial levels, a record with unprecedented ocean heat content) in multiple regions (Figure 10). During the year 2025, global temperature should remain near or above +1.5°C relative to 1880-1920, and, if the tropics remain ENSO-neutral, there is good chance that 2025 may even exceed the 2024 record high global temperature.
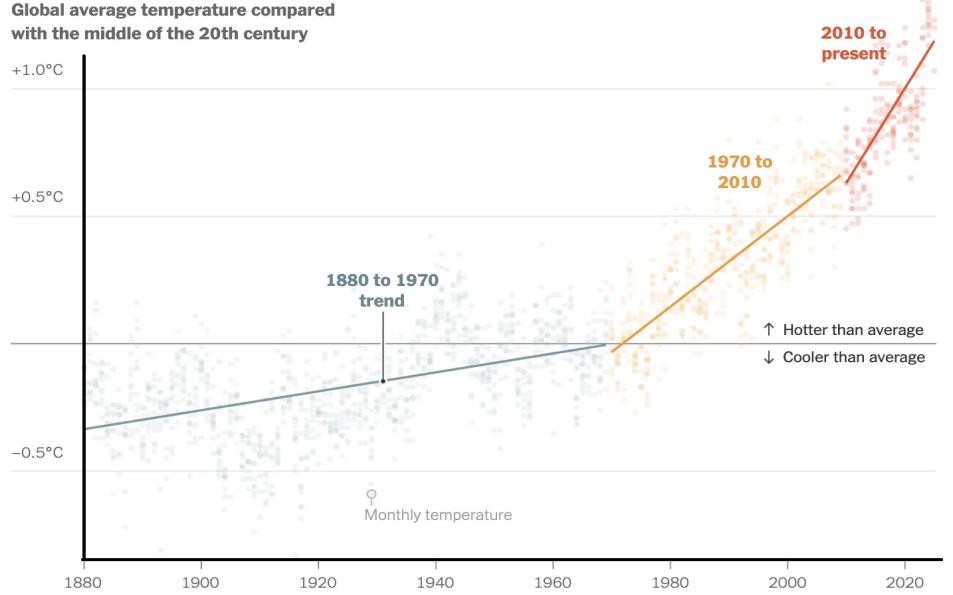
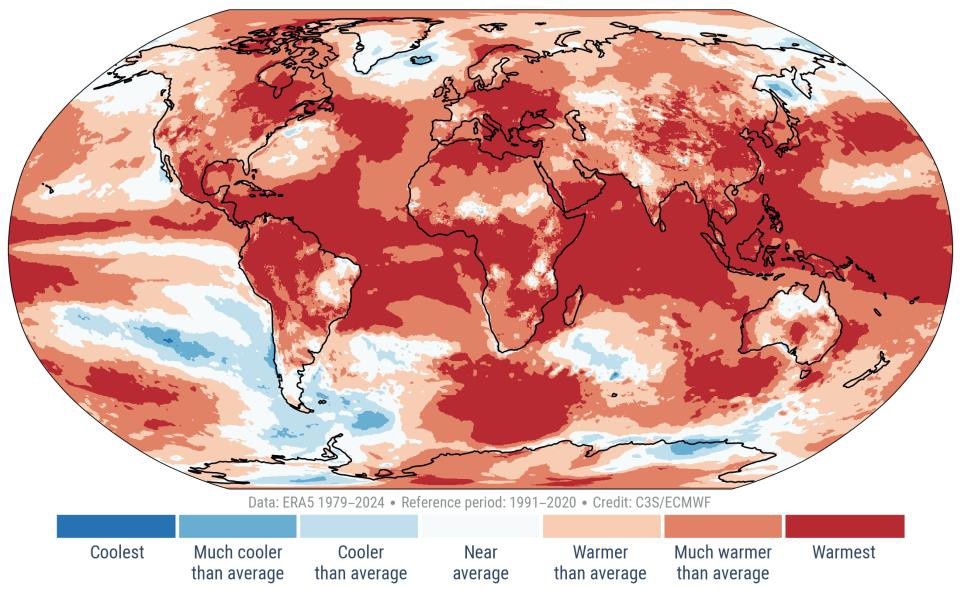
Figure 9: Recent trends in rise in global mean temperatures have accelerated.
Figure 10: Anomalies and extremes in spatial distribution of land & oceanic surface temperatures in 2024.
Oceans are an important climate regulator and carbon sink, and cooler waters can absorb greater amounts of heat from the atmosphere, helping to lower air temperatures. They also store 90% of the excess heat trapped by humanity’s release of greenhouse gases. Records, however, suggest that, in 2024, both global sea surface temperature (SST) and upper 2000 m ocean heat content (OHC) reached unprecedented highs in the historical record (~16 ZJ higher than the 2023 value). The Indian Ocean, tropical Atlantic, Mediterranean Sea, North Atlantic, North Pacific, and Southern Ocean also experienced record-high OHC values in 2024. The exceptionally warm sea surface temperatures in 2023 and 2024 have heightened concerns about large-scale ocean and atmosphere interactions such as risks of more extreme and costly El Niño events under climate change, and even the threat to the stability of the Atlantic Meridional Overturning Circulation (AMOC) (Figure 11). It appears that the target of staying below 1.5°C threshold established by the Paris Agreement is unobtainable, and the long-term average will pass this milestone within the next five to ten years. Cloud- heavy regions are shrinking by about 1.5% per decade, reducing Earth's reflectivity and driving warming.
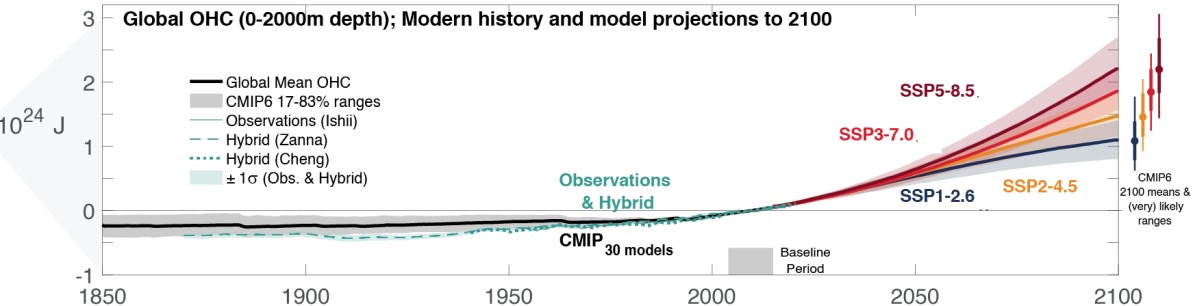
Figure 11: The past, present and future of ocean heat content between surface and 2000m depth as observed and projected by CMIP6 Models.
The world seems to be on track for a 2.7-3.4°C rise in temperature or higher over the pre-industrial average by 2100, wreaking enormous damage to the global economy, natural ecosystems and human life, unless, the balancing the intake of energy on the Earth is achieved by removing GHGs, and also involves other techniques to reflect more energy away from the planet. Unfortunately, we have not transitioned off of fossil fuels quickly enough, and we are not doing Carbon Dioxide Removal at a fast enough rate to counteract this completely in the short term. As a consequence, we are now at great risk that negative feedback loops accelerate in a catastrophic and cascading way, where things like reflective white ice melts due to the increased energy and heat in the system, which exposes more dark sea surface, which absorbs energy and warms the water in a runaway situation, which takes us to dangerous tipping points.
The current decade is crucial for aligning world emissions to a pathway compatible with the 1.5°C temperature change target set out in the Paris Agreement. To prevent the 2015 Paris Agreement’s goals from being shattered – and to ensure that Earth system’s tipping points are not breached – emissions must decrease by 9.0% annually from 2024 (triple the renewable energy capacity and double the rate of energy efficiency improvements by 2030) to keep warming below 1.5°C by 2030. However, G20 climate policies and pledges fall short of the 1.5°C pathway. The commonly used ‘net zero’ carbon budgets only give a 50/50 chance of limiting warming to well below 2°C (Figure 12). Despite ambitious efforts to mitigate emissions, it is increasingly clear that the world’s 1.5°C pathway is likely to result in global temperature overshoot (increasing climate impacts on natural and human systems and triggering potential irreversible tipping points in the earth’s climate system), and therefore negative emissions from both land-use sinks and the energy sector are required to limit the global temperature increase. This becomes more relevant now as, by exiting the Paris Agreement on 20th January 2025, United States, the world’s biggest historic emitter, has joined Iran, Libya and Yemen as the only countries not committed to the global deal to keep global warming well-below 2°C by the end of the century. U.S. President D. Trump has also signed a bill temporarily halting offshore wind lease sales in federal waters and pausing the issuance of approvals, permits and loans for both onshore and offshore wind projects.
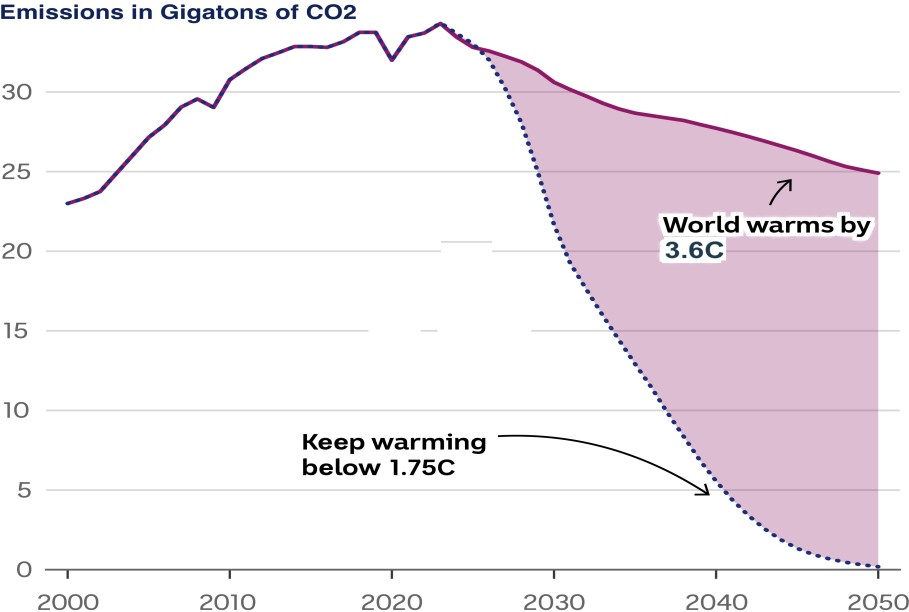
Figure 12: Cut back on emissions will dictate how much the world would warm by 2050.
In practical terms, the world has reached 1.5°C of warming and the pace of warming is increasing. The global mass loss of glacier ice has increased significantly in the last 30 years and amounted to 335 billion tons of lost ice per year during the period from 2006-2016 (Figure 13). An accelerated rate of warming is likely to continue to mid-century and beyond given the failure so far to reduce the planet-warming greenhouse gas emissions. Global mean surface temperatures in 2025 and beyond will remain alarmingly high and calls for urgent, collective action to mitigate emissions and adapt to changes to build a sustainable future. Today, the climate risks faced by agriculture, energy, transport and manufacturing value chains are undeniable. Further, as extreme weather events become more frequent and severe, early warning systems are crucial to ensure resilience across value chains, reducing response times and resulting losses for local communities across developing world.
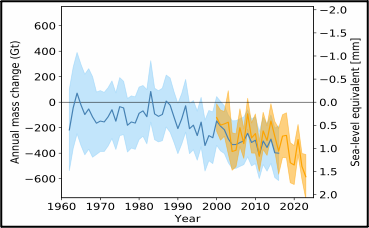
Figure 13: Global glacier contributions to sea level rise from 1961-62 to 2022-23. Annual mass changes and global sea-level equivalents are shown with related error bars (indicated by shadings) corresponding to 95% confidence intervals. The ad hoc estimates (orange), based on the glaciological sample and calibrated with regional geodetic estimates are shown with adjusted and updated annual values (blue) from Zemp et al. (2020).
Indian Sub-continent: Current Status of Climate Change
Global warming was 1.5°C in 2024, and 2025 will be hotter. In practical terms, the world has reached the lower end of the Paris target of 1.5-2°C of warming and an accelerated warming rate is likely to continue beyond mid-century. Given the current lack of willingness of human society to rapidly reduce greenhouse emissions, we are heading towards at least 3.4°C of warming and more by the end of this century (Figure 14). Many events in the climate system are still beyond climate models’ projections; that is, current models are not capturing all the risks. They overlook or downplay the impacts of non-linear and difficult to predict processes such as the loss of ice sheet mass (in 2023 the rapid retreat of Antarctic sea-ice was astounding and five standard deviations beyond the mean), ocean heat drawdown (the rapid warming of the North Atlantic was greater than four standard deviations in 2023), rising sea levels (a one-meter sea level rise on both sides of the North Atlantic), upticks in extreme events, carbon stores losing integrity amount of carbon absorbed by the land sinks could collapse), and more. Climate change is significantly affecting the species population and ecological systems as well. In a 3°C hotter world, new extremes will occur — of unliveable heat and rainfall (AMOC collapse would result in the South Asia monsoons becoming unreliable), flooding and drought — beyond past human experience. With just 1.5°C global warming, many glaciers throughout the world as over Himalayas are already losing their ice-mass; eventually aggravating water scarcity on one hand and the sea level rise drowning coastal cities on the other hand. A committed sea level rise of few metres will be in the process of inundating coastal cities and deltas along India's coastline.
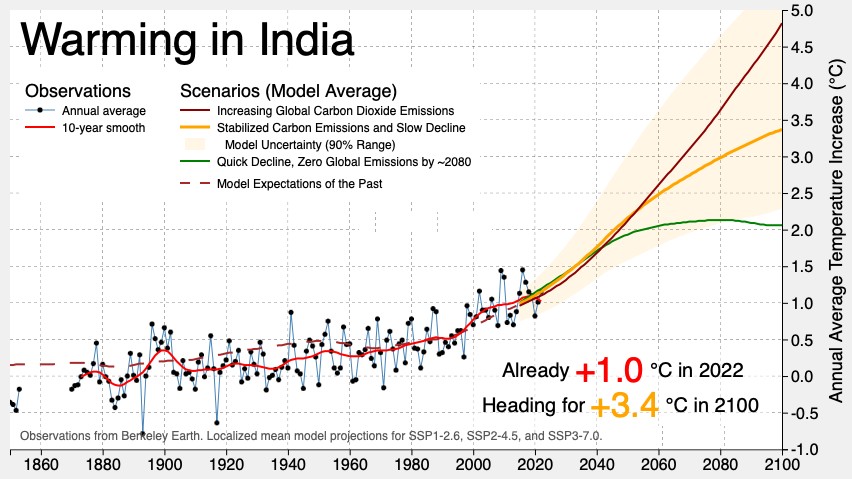
Figure 14: Projected future warming over India under different SSP Scenarios (Source: Berkley Earth)
In the last few decades, India’s climate vulnerabilities, as well as the economic losses experienced as a result of them, have increased dramatically. Significant investments in disaster risk management are needed to safeguard human lives and infrastructure while minimizing economic disruption. This is particularly true of more cost-effective tools like early warning systems and making infrastructure more resilient. The challenges India will encounter by the end of this decade will perhaps be nothing less than an outcry for immediate and urgent climate actions for mankind’s basic comfort zone (particularly to overcome potentially disastrous repercussions for our marginalized communities). Impacts on our food systems, infrastructures, finances, ecosystems will have devastating effects on the future generations (often seen as an unaffordable, incremental cost that competes with other national development priorities). The projected productivity and resilience gains by investing in modern agricultural practices and technology; installing treatment systems for agricultural waste and water, and improving climate-resilient rural infrastructure, such as building more efficient irrigation systems and better drainage and creating and rehabilitating wetlands through measures such as hillside terraces and tree planting are expected to increase food production and bioenergy generation, reducing soil erosion, improving local water quality, restoring forest ecosystems in degraded areas, sequestering planet-warming carbon as well as avoid other climate shocks thus facilitating job creation and productivity gains to healthier rural communities and environments. Today, India stands at a crossroad where if we not take a step towards quick and just transitions, the very survival of humanity will be jeopardized. The battle we face is not only about climate action but to achieve a just transition that will be inclusive of all sections of the society, so that building collective resilience and adaptation mechanisms at grass-root levels, and maintaining the ecological balance will be possible. India is, indeed, in the midst of a compound catastrophe due to worsening climate impacts.
What all may Change in the Climate Challenged India
Heat Stress and Heat-related Mortality
Mean temperatures across India rose by more than 0.5°C between 1960 and 2009, with statistically significant increases in heat waves. A heat wave is a prolonged period of unusually and excessively hot weather, which may also be accompanied by high humidity - definitions vary, in part because a heat wave is measured relative to the usual weather in the area and relative to normal temperatures for the season. A heat wave in India is declared when either there is an excess of 5°C over a normal daily historical maximum temperature (30 year average) of less than 40°C; or an excess of 4°C over a normal historical maximum temperature of more than 40°C. If the actual maximum temperature is above 45°C, a heat wave is declared irrespective of the normal historical maximum temperature. The increase in summer mean temperatures in India over this period corresponds to a 146% increase in the probability of heat-related mortality events of more than 100 people. In May 2010, Ahmedabad, India, faced a heat wave where the temperatures reached a high of 46.8°C with an apparent increase in mortality. On May 19, 2016, Phalodi in Rajasthan recorded the highest temperature of 51°C, which was also the third-highest temperature ever documented globally that year. In 2019, Churu -- a deserted region in Rajasthan -- recorded the hottest day of the year, with the mercury touching 50.8°C on June 2. This year, Rajasthan and Madhya Pradesh were also on alert for 'severe heat wave conditions', with both the states often recording warm days at the peak of summer. In 2022, Uttar Pradesh's Prayagraj broke its all-time record to become India’s hottest city on April 27 as the city recorded a temperature of 45.9°C. In the
year 2023, several locations in India experienced high temperatures, with some exceeding 45°C. Mungeshpur and Najafgarh, both in Delhi, recorded 48.3°C and 48.1°C respectively, while Narnaul reached 47°C. Other locations like Faridkot, Akola, Yavatmal, Sagar, and Guna also saw temperatures above 46°C. India recorded the year 2024 as warmest as is evident from deviations from normal of average annual mean temperature (the warmest of the five years as listed in Figure 15 below). The highest temperature recorded in India during 2010-2024 was 52.9°C in Delhi's Mungeshpur area on May 29, 2024. The year 2024 reported the most intense and the highest number of heatwaves in the past 15 years (Over 37 cities recorded temperatures exceeding 45°C). Buxar in Bihar recorded 47.2°C, the highest in the country on Thursday, which was 8.9 degrees above the normal maximum temperature for the season. The year 2025 is no exception. February 2025 was India’s hottest in 125 years, with many states breaching 40°C. Reports of heat-related deaths came in from Telangana, Gujarat, Punjab, and Odisha. Temperatures in India have again climbed to “dangerous levels” in April 2025. Delhi has recorded temperatures above 40°C “at least three times this month”. Sri Ganganagar in West Rajasthan reported a maximum temperature of 49.4°C on 13th June 2025. This is the season's highest maximum temperature reported by any station for the year 2025 over India. Such unusually high temperatures during hot summer season result in the dangerous exposure of heat stress and becomes vulnerable to physiological acclimatization among the workers carrying out activities in outdoor and indoor work places without thermal neutralities.
|
|
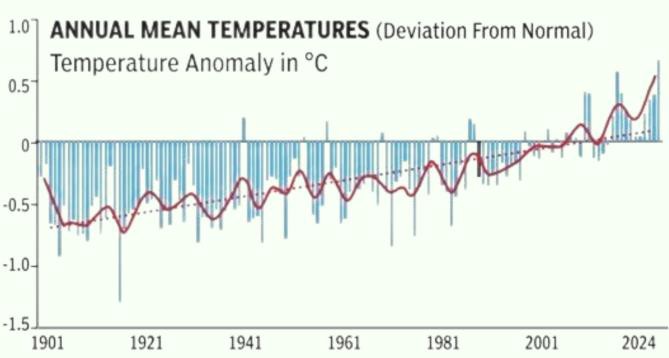
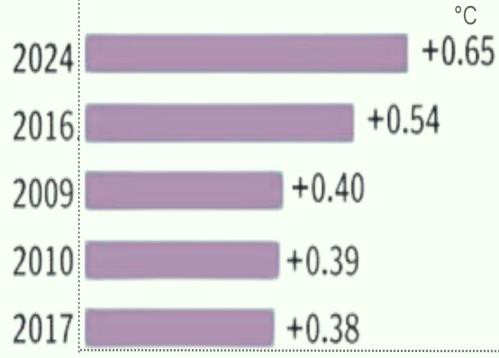
Figure 15: Deviations from normal in annual mean surface temperature and the five warmest years in India (Source: IMD, Jan 2025)
Extreme heat is no longer a distant threat. Over the past few years, it has claimed lives, destroyed crops, disrupted governance, and pushed India’s systems to the brink. In 2022, intense heatwaves devastated wheat crops, prompting an export ban. A year later, over 600 people suffered heatstroke at a state award ceremony in Khargar; 12 died. And in 2024, at least 33 people, including election officials, died from suspected heatstroke during the Lok Sabha elections.
Yet, despite these rising impacts, extreme heat continues to be treated as a seasonal, static, and short-term risk. In reality, heat is complex, pervasive, and deeply unequal in how it impacts different communities and sectors. As India is more vulnerable to the heat extremes such as heat waves, heat stress due to its projected annual spatial warming in India will be between 2.8° and 5.5°C by the end of this century, with higher projections over northern, central, and western India. The rising temperatures are testing human limits and, by 2050, “India will be among the first places where temperatures will cross survivability limits” with exacerbated disparities in income, gender difficulties, and socio-cultural factors among its large pupulation. A single day of an India-wide heatwave can lead to an estimated 3,400 excess deaths nationally, while a single five-day heatwave could lead to approximately 30,000 excess deaths, distributed across rural and urban districts. Heat waves in a sizable part of India are likely to become more intense, more frequent, and longer lasting in the second half of this century. With India’s urban population projected to reach 600 million by 2036, the challenge of ensuring a thermally comfortable living environment is urgent and central to safeguarding health and well-being of its population. The priority action should include practical solutions to sustainable cooling, green urban planning, early warning systems, and passive cooling solutions like tree planting etc.
Changes in Spatial and Temporal Rainfall Variability and Associated Hazards
The Indian monsoon is one of the most prominent parts of the world’s monsoon systems, which blows from the northeast during cooler months and reverses direction to blow from the southwest during the warmest months of the year. This process brings significant rainfall to the region from June to September, the principal rainy season. Nearly 75% of the country’s annual rainfall is received during the southwest monsoon season with a large inter-annual variability in its onset and withdrawal dates as well as spatial variability in its distribution over different parts of the country. Based on data from 1971-2020, all-India normal annual rainfall is 1160.1 mm. On average, about 868.6 mm
of rainfall is received over the country between June and September during the monsoon season (Figure 16). Although, there is inter-annual variability (largely attributed to predictable mode of El Niño- Southern Oscillation, equatorial Indian Ocean Oscillation in Indian Ocean Dipole mode, Atlantic Meridional Oscillation and Pacific Decadal Oscillation), the total precipitation during the Indian summer monsoon has remained largely stable over the period 1901-2023 (Figure 17). However, a weakening link between monsoon rainfall and El Niño observed in recent years has led to south-eastward movement of the walker circulation anomalies which has enhanced the inter-annual variability in seasonal rainfall.
Throughout the season, the Indian Summer Monsoon (ISM) is characterized by strong circulation at 850 hPa southwesterlies and 200 hPa upper-level easterly jet. Southward displacement of the Asian jet is observed to have a substantial impact on ISM rainfall (JJAS) primarily in northern and central India. Weak Tropical Easterly Jet changes the low-level ISM circulation, resulting in changes in active - break cycle (Monsoon Intra-Seasonal Oscillations - MISOs cause the fluctuations on two broad scales of 10–20 and 30–60 days) and thus leading to intra-seasonal variability in rainfall over India. The Indian Ocean, also the warmest among the world's oceans and part of the Indo-Pacific warm pool (SST > 28°C), plays a pivotal role in maintaining deep atmospheric convection and tropical circulation. The Indian Ocean is also the birthplace of critical climate phenomena like the Madden-Julian oscillation (an intermittent wave of enhanced tropical convection that transits west to east through the entire tropics in 30 to 60 days) and monsoon intra- seasonal oscillations, which impact rainfall and tropical cyclones on shorter timescales.
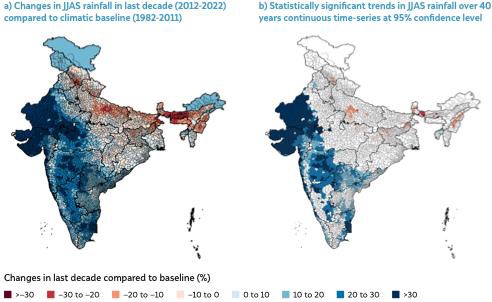
Figure 16: The monsoon rainfall has increased in majority of the country, but decreased over Indo-Gangetic plains, north- eastern India and Indian Himalayan region in the last decade.
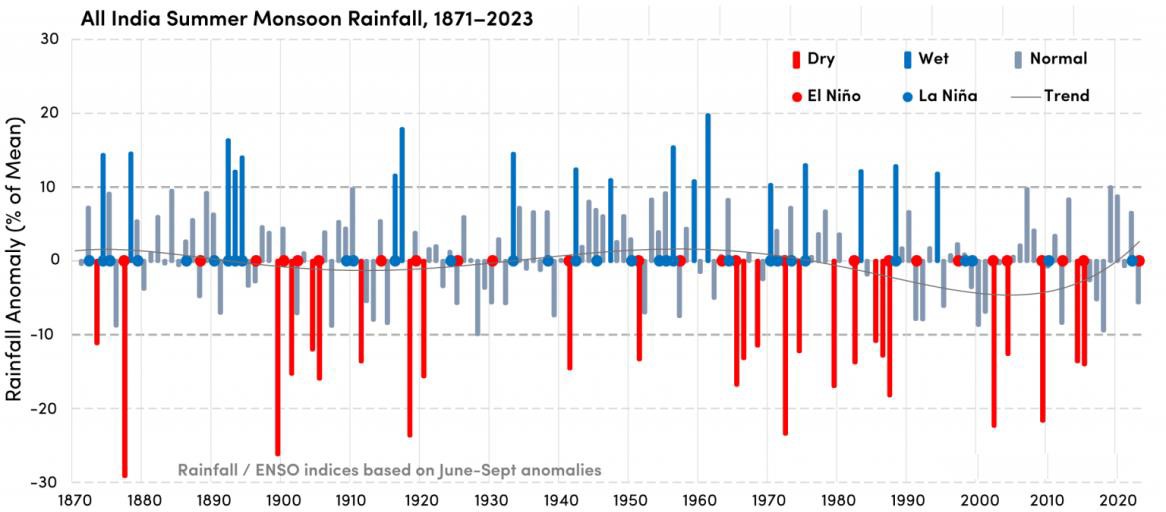
Figure 17: All-India averaged JJAS rainfall shows a slightly increasing but insignificant trend at the rate of 3 mm/year for the period from 1871 to 2023.
The enhanced greenhouse gas emissions may alter the monsoon circulation and in turn, lead to changes in rainfall patterns and intensities. The warmer Indian Ocean, which accentuates the land-ocean contrast and thus increase the amount of atmospheric moisture carried to India during summer months. During the recent decade, there has been a significant decrease in light and moderate rainfall events, while heavy and very heavy rainfall events have increased in frequency (Figure 18).
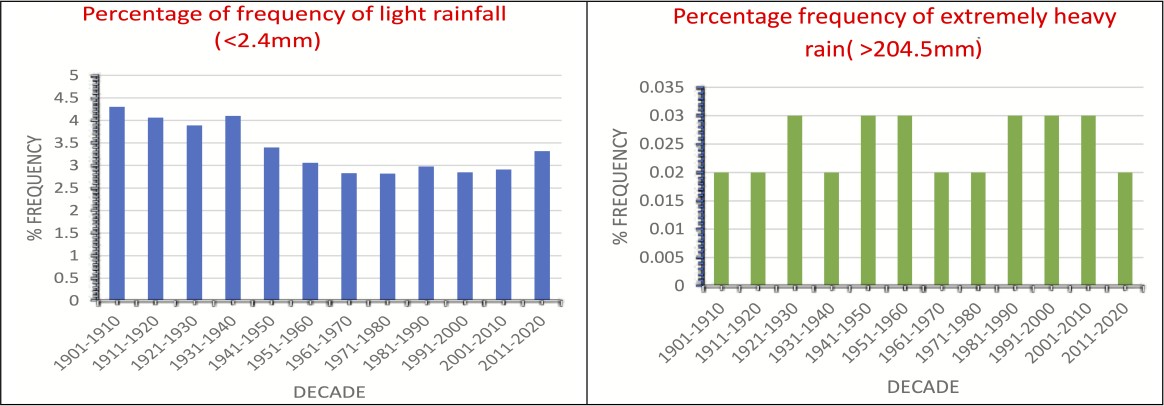
Figure 18: Percentage frequency of decadal light and very heavy rainfall events during monsoon season in India during 1901- 2020.
The regional climate in the tropics is strongly influenced by the Inter Tropical Convergence Zone (ITCZ), also known as the monsoon trough over the Indian subcontinent. Understanding the physical processes that determine the ITCZ's location, strength, and width, and how it responds to radiative forcing and natural variability, is crucial. The expansion of greenhouse gases and aerosol forcing in the NH, along with stratospheric ozone depletion in the southern hemisphere, has led to a poleward shift of the subtropical edges of Earth's Hadley circulation during summer and monsoon seasons. Recent Indian Ocean warming (warmed rapidly and notably at a faster rate than the other tropical ocean basins in the latter half of the twentieth century) has also been linked to anomalies in the lower and upper troposphere, driven by increased latent heat uplift due to ocean convection. This warming intensifies convection over the ocean while leading to subsidence over land, reducing convection over the subcontinent and causing a drying trend. Another significant factor contributing to decreased rainfall since the mid 20th century is the narrowing of the ITCZ, related to changes in upper tropospheric relative humidity, cloud-radiative feedbacks, and the associated belt of ascending motion and rainfall over India. This narrowing is associated with various factors, including moisture diffusion, cloud-radiative and water vapor-radiative effects, and the skewness of vertical velocity distribution. The poleward shift of the Hadley circulation is a robust response to a warming climate in global climate models. Historical observations indicate that regional Hadley circulation, driven by the North Atlantic Oscillation in the northern hemisphere and the Indian Ocean Dipole in the southern hemisphere, may influence Indian monsoon behaviour in coming decades. In the Northern Hemisphere, the direct radiative effects of CO2 enhance the land-sea temperature contrast, shifting the circulation poleward. Also, the SST warming in tropical oceans reduces the land-sea temperature contrast and shifts the circulation equatorward. This shift is evidenced in re-analysed ERA5 data from the past five to six decades, showing a contraction of the Hadley circulation by about 0.5o latitude per decade. These Hadley and Walker circulation anomalies, particularly over Central India, are also observed in CMIP6 simulations where tropical circulation weakens by about 10- 15% with the lifting of the tropopause height over the twenty-first century. The specific pattern of SST warming in tropical oceans and coupled atmosphere-ocean variability is crucial for understanding how the NH JJA Hadley cell edge contracts over the 21st century. It's worth noting that a northward shift of the monsoon trough over India during the summer monsoon season during the past few years have led to more erratic short spells of very intense rainfall across Rajasthan, Delhi, Punjab, Haryana, Jammu & Kashmir, Uttarakhand, Himachal Pradesh, Uttar Pradesh and Bihar. A northward shift in monsoon trough is also found to strengthen a secondary tough off the west coast of India in June - July - August which results in heavy to very heavy rainfall spells along Kerala coast, Maharashtra, Goa, Karnataka (along Sahyadri mountains) and Gujarat coastal regions.
There have been multiple devastating floods in different regions of India in past decades due to incessant monsoon rainfall, cloudbursts, changes in the land use pattern (key factor for urban floods), and GLOFs due to melting of glaciers. The Mumbai flood in 2005, Bihar floods in 2007 and 2008, Assam flood in 2012, Uttarakhand floods in 2013 and 2021, Jammu & Kashmir floods in 2014, Chennai flood in 2015 and, most recently, the Kerala floods in 2018 and 2024 can
be identified as the most severe ones. With a death toll of over 6,000, the 2013 floods in Uttarakhand were one of India's worst ever natural disasters. this flood resulted in over 6,000 deaths in Kedar Nath valley and surrounding areas. The flash floods, triggered by heavy rainfall combined with melting of the Chorabari Glacier, caused a breach of the Chorabari glacial lake and claimed a large number of lives and causing widespread destruction. Again GLOF disaster struck Joshimath of Chamoli District on 7 February 2021 (occurred in an area about 60 km northeast of where the flash flood occurred in 2013), when a massive flash flood ravaged through the valleys of the Rishi Ganga, Dhauliganga and Alakhnanda rivers. More than 70 people were confirmed dead and another 134 people reported missing. The flood swept away the unfinished Tapovan Vishnugad Hydropower Project and inflicted substantial damage on the Rishi Ganga Hydropower Project. A “torrent of mud” has killed more than a dozen people in the northern Himalayan state of Uttarakhand and destroyed the entire village of Dharali on 5th August 2025. "Multiple cloudbursts” together with GLOF in the Himalayan region also hit the high-altitude districts of Uttarkashi, and Jammu & Kashmir triggering flash floods. The cloudburst risks are “projected to increase with climate change” since the number of glaciers in the Indian Himalayas are “receding at an alarming rate due to global warming”. Extreme rainfall events are projected to rise in intensity throughout the 21st century in the entire Himalayan-Tibetan Plateau region, particularly during the summer monsoon.
In South India, incessant heavy rains for over 24 hours on 30th July 2024 in the Wayanad region (bordering the Nilambur forests and the Chaliyar river) of Kerala (this disaster was one of the deadliest in Kerala's history) led to flash floods in the Chooralmala area – a place where deadly consecutive landslides washed out two villages, devastated a total of 600 ha of land and claimed over 400 fatalities. In India, since independence, substantial progress has been achieved in flood disaster preparedness, recovery, and management activities. The flood risk in India has also been exacerbated by exposure growth and urbanization in riverine floodplains. With the unprecedented growth of civil construction activities in flood-prone regions in India with each passing year, there is an urgent need to review the developmental activities and to strive to make them more resilient for the future by considering robust strategies. The currently available climate models often do not capture these links due to inconsistencies in representing regional teleconnection features (a stochastic climate signal is essential for accurate flood prediction assessment). However, such a notable northward shift of monsoon trough and associated cloud bursts can complicate the distribution of future monsoon rainfall over major river basins in north-central India.
The physical explanation for the increase in the precipitation extremes with temperature is typically offered by the Clausius–Clapeyron (C-C) scaling. However, the majority (more than 80%) of extreme precipitation events occur during the monsoon season, which indicates that the negative relationship between surface air temperature and precipitation extremes is largely driven by precipitation-temperature coupling in the monsoon season. It is well known that the tropical regions are known to exhibit changes in precipitation extremes that do not correspond to C-C scaling. In India, thermodynamic components (e.g., changes in the atmospheric moisture content) have a minimal influence on changes in the characteristics of precipitation extremes since the intensification of extreme precipitation over the South Asian land mass emerges from dynamic rather than thermodynamic changes. Moreover, during summer, moisture availability, and not the moisture holding capacity, plays a dominant role in the changing characteristics of precipitation extremes. Extreme precipitation and flooding events are projected to further intensify in the future under a warmer climate. Climate change continues to be perceived as the gravest threat to humanity and, "climate action failure”, “extreme weather” and “biodiversity loss” rank as the three most potentially severe risks and as strong aggravators of “livelihood crises” in India during the next decades. The physical impacts of future climate change- related events (heat waves, floods, droughts, wildfires, deforestation and air / water pollution), the fast-and-yet-slow elements of climate change (extreme weather events and chronic exposure) would bedevil our national capacity to absorb projected losses. In India, more than 22.5 million hectares of degraded land has been restored through various measures such as afforestation, reforestation, agroforestry, integrating advanced technologies in forest monitoring, supporting the G20’s trillion-tree pledge and more. Nature-based strategies, supported by aligned policies, strong targets, local action, and regulatory clarity, are key to India’s holistic response to ecosystem restoration, forest cover and land use goals.
Climate Change along India's Coasts and Associated Hazards
Climate risk has also spread to our oceans which have historically been buffering communities from the worst impacts of climate change. Coastal regions are unique because of their position at the interface of the atmosphere, lithosphere, and hydrosphere. Across India's coast, the important marine ecosystems include wetlands, mangroves, tidal mudflats, lagoons, beaches, marshes, and coral reefs. More specifically, within the peninsular region of India, there are 25 Marine Protected Areas (MPAs), 97 significant estuaries, 34 major lagoons, 5,790 km2 of coral reefs, and mangroves
spread over 4975 km2. The impacts of climate variability and change and extreme events on these systems are affecting India’s coastal community and strategically important infrastructures. Sustainable fishing and other aspects of the blue economy are being compromised by the accelerating climate impacts on the oceans. These include marine oxygen depletion, marine heatwaves (in the past few decades), accelerating ocean acidification, and other extreme conditions. The unravelling associated with cascading effects is becoming even more pronounced for our coastal communities. The solution requires increasing attention on the role of resilience in blue carbon ecosystem and fortifying individuals and communities in the face of grave loss of lives, livelihoods and system function along India's coastline.
India's more than 7500 km long coastline spreading over nine states and five union territories (+1208 island territories) of flat coastal terrain, shallow continental shelf, high population density, geographical location, and varied physiological features are extremely vulnerable to cyclones and their associated hazards. Thirteen coastal states and Union Territories (UTs) in the country, encompassing 96 coastal districts, including 72 touching the coast and 24 not touching the coast, are affected by tropical storms. These synoptic scale systems, including low-pressure areas and cyclonic disturbances (depressions and cyclones) that form over the northern Indian Ocean and particularly over the Bay of Bengal during the southwest monsoon season, contribute significantly to the southwest monsoon rainfall over India. A decreasing trend has been observed in the total number of cyclonic disturbances (cyclonic storms and depressions put together) during the period 1951 – 2023. However, the frequency of more intense cyclonic storms hitting India's coastline have increased in recent decades.
The current climate models overlook or downplay the impacts of non-linear and difficult to predict processes such as the loss of ice sheet mass, ocean heat drawdown, rising sea levels, upticks in extreme events, carbon stores losing integrity, and more. For example, models have been unable to reproduce the frequency and intensity of persistent summer weather extremes of recent years. In 2023, the rapid warming of the North Atlantic was beyond model expectations (greater than four standard deviations). Likewise, in 2023 the rapid retreat of Antarctic sea ice was astounding and five standard deviations beyond the mean. Permafrost is thawing much more quickly than models have predicted, with unknown consequences for greenhouse gas release. These climate risks are existential and emerging faster than forecast. Their non-linear and cascading nature make them difficult to predict, so particular attention must be paid to the plausible worst-case scenarios, because that is where the greatest possible damage lies.
Future emissions are a primary determinant of the warming path over the medium to longer term; but so are other factors including accelerated sea ice loss decreasing Earth’s reflectivity, and accelerating emissions from carbon stores. India has demonstrated strong climate leadership under the Paris Agreement and is on track to meet its existing Nationally Determined Contribution (NDC) for 2030. However, in absolute terms India has not yet started to decarbonise because lower emissions from electricity use are being offset by growth in other areas of energy use. So, for the time being at least, we are not experiencing an energy transition: what humanity is doing is adding energy from renewable sources to the growing amount of energy it derives from fossil fuels. What we need is clear and consistent Sector-Specific Policies and Regulations to support NDC Implementation with a tailored intervention for high emission sectors.
Implications for Future Global Warming in India & How To Cope With It?
Whilst rainfall is projected to increase in the tropical zone under future warming scenarios, it will be too hot to live or for crops to survive here. At 3°C of warming, water availability is also projected to decline sharply in the, affecting about millions of people, and agriculture may become non-viable in critical areas. In India, a 3°C hotter atmosphere, would result in new extremes — of rainfall and unliveable heat, flooding and drought — beyond past human experience. And a committed sea level rise of few metres will be in the process of inundating our coastal cities and deltas.
Climate change impacts have direct consequences for water security. Despite having approximately 18% of the world’s population, India has only approximately 4% of the world’s freshwater resources. According to the Central Water Commission, the annual average per capita water availability in India between 2021 and 2031 is assessed to be between 1486 cubic meters and 1367 cubic meters per person, respectively. Increasing water use efficiency is an affirmation of India’s commitment to the Environment by optimizing the use of limited water resources and minimizing wastage. India’s national water supply is forecast to fall 50% below demand as early as 2030. By mid-century, water flows into the key rivers of Asia will be reduced by the loss of more than one-half, and perhaps much more, of the Himalayan ice sheet. In the coming decades, the impact of climate change threatens to make floods and droughts
more frequent and intense, and so there is a need for adequate adaptation measures to ensure water security, power generation, drought mitigation, and flood control.
The Himalayan glacier systems are an important ecosystem within the Indian sub-continent. Water supply from snow and glacier melt affects the livelihood of large Himalayan Mountain communities. The Himalayan Mountain range supplies water to major Indian rivers, including the Ganga and the Brahmaputra. The loss in mass of glaciers has declined by as much as a quarter over the last four decades and the rate is accelerating. This may potentially increase the number of glacial lakes and expand the size of existing ones. Climate change (rising temperatures and extremely heavy rainfall) has played a key role in the “catastrophic” floods and landslides in the Himalayan states of Jammu & Kashmir, Himachal Pradesh, Uttarakhand, Assam and Sikkim in recent years. The Indian Himalayan Region (IHR) is facing critical challenges while coping with the adverse effects of climate change. Climate change is most likely to enhance the retreat of glaciers.
The development of agricultural production and productivity is key to rural development in India as agriculture retains 45.6% of the total workforce (NITI Aayog, 2022). With a net sown area of approximately 140 million ha, which has remained the same in recent years, food grain production in 2021-22 rose to 315.72 million tonnes here. Indian farmers especially the small and marginal farmers have traditionally always grappled with the effects of climate variability and extreme events. India is the world’s second largest producer of rice, accounting for 21% of global production. Rice production failure is a major threat to food security and supply chain resilience across India. Understanding causes of rice production failures is thus critical for policymakers due to their severe effects on farmers, societies, economies, and global supply chains. Temperatures equal to or higher than 30–34°C at the time of flowering may inhibit pollen production and grain setting, giving unstable yields from year-to-year; lethal limits beyond which the plant dies are in the range of 45–47°C. Higher minimum temperatures pose risks by reducing spikelet fertility and sink strength in developing grains, leading to lower grain weight and quality. The probability of crossing such thresholds in a given year becomes increasingly significant with global temperature rise of more than 2°C, and in the worst cases reach somewhere in the region of 25% (maize) and 75% (rice) respectively with temperature rise of around 4°C.
Reduced or erratic precipitation also lowers yields by increasing drought stress. India’s rice production is strongly dependent on the Asian Summer monsoon, during which the vast majority of rice is grown, particularly in the Indo- Gangetic Plains. The majority of rice in India is grown in the summer kharif (June to October) season when most regions receive 80% of their annual rainfall. Timing of monsoon onset is crucial as well, with delays often linked to lower yields. Dates of rice growth stages vary by region but typically planting occurs in June/July (nursery planting followed by transplanting into main field 12– 14d later), vegetative growth in July to September, flowering in September–October and harvesting in October–November. Most kharif rice irrigation in India relies on traditional flood irrigation, supplied by canal systems and groundwater pumping.
Heatwaves and floods have particularly caused major damage to crop production, and crop harvesting activities in India in recent years. Irrigation coverage is also a significant determinant of failure events. Districts under more temperature and water extremes during the growing season and with less than 5% irrigated rice area can have highest failure probability, while areas with more than 18% irrigation may lead to a nominal reduction in rice productivity. This suggests irrigation buffers against drought and heat stress. Recent studies suggest that most considerable reductions may occur in southern states like Karnataka, Tamil Nadu, Andhra Pradesh, and Telangana, with some areas seeing up to 20% reduction in failure risk. Targeted adaptation strategies such as earlier transplanting or adopting shorter- duration rice varieties may help reduce exposure to temperature and water stress could help mitigate rice production failures to some extent. However, an average one-fifth or more decline in crop yields projected in a 3°C scenario is likely along with a decline in the nutritional content of crops, catastrophic decline in insect populations, desertification, monsoon failure and chronic water shortages, and conditions too hot for human summer habitation in significant food-growing regions.
Forests are important ecosystems in India which provides various ecosystem goods and services. Forests are also regions of biodiversity hotspots. With only 2.4% of world’s land area, India accounts for 11% of recorded species of bio-diversity, including threatened and at-risk flora and fauna of the world. India is one of the few countries where forest and tree cover has continued to increase over the years, qualifying the country’s forests as net sink. The total forest and tree cover of the country in 2023 stands at 8,27,356.95 km2 which is 25.17% of the geographical area of the country. The total Forest Cover has an area of 7,15,342.61 km2 (21.76%) whereas the tree cover has an area of 1,12,014.34 km2 (3.41%). India has committed to creating an additional carbon sink of 2.5 to 3 billion tonnes CO2eq
through additional forest and tree cover by 2030. It is also recognized that climate change adaptation must build resilience, strengthened through healthy ecosystem services that rely on well-functioning river basins of India.
Developing a process for monitoring, reporting and acting on the risks that leverages the resilience principles provide clear, concise, timely and realistic information to policymakers could help to accelerate risk-informed policy decisions and avoid catastrophic impacts that are likely on current trajectories. India would need to build resilience to worsening and inevitable climate impacts through accelerating decarbonisation by reducing emissions to zero as quickly as possible, by identifying and leveraging positive socio-economic tipping cascades. Our climate goals must be defined from a risk perspective as excluding risks due to uncertainty breaches the precautionary principles.
Decarbonization of high energy-using sectors is essential for tackling climate change. Intervention strategies targeting demand-side mitigation with distinct emphases focussing on reducing or changing activity, improving technological efficiency and electrifying energy end use can reduce emissions by 51–85% in buildings (encompassing residential and service-sector buildings) and 37–91% in transport (encompassing aviation, navigation and land transport) by 2050 relative to a current policies scenario (ranges indicate model variability).
Meeting the Paris Agreement to limit global warming to “well below 2°C” requires global anthropogenic net greenhouse gas emissions to decline rapidly to zero, meaning a radical acceleration of actions on low-carbon transitions in a range of sectors to achieve a maximum rate of decarbonisation, as the global economy is decarbonising at least five times too slowly. Tipping points, where low-carbon transitions become self-propelling, could be key to achieving the necessary acceleration. We deem these normatively ‘positive’, because they can limit considerable, inequitable harms from global warming and help achieve sustainability. The challenge now is to credibly identify potential positive tipping points, and the actions that can bring them forward, whilst avoiding wishful thinking about their existence, or oversimplification of their nature, drivers, and impacts.
Dr. Murari Lal
Renowned Climatologist & Nobel IPCC Team MemberExploring climate models, regional monsoons, and adaptive environmental policy solutions.
